Breaking the Cycle of Structural Oppression in Capital Markets

Breaking the Cycle of Structural Oppression in Capital Markets[1]
Executive Summary:
Five Market Failures Demanding Immediate Action
American capital markets face systemic inefficiencies that misallocate resources on a massive scale. The data reveals five critical failures requiring coordinated response from Chief Executive Officers, regulators, and investors.
- The Public Markets Crisis: America has 40% fewer publicly traded companies than in the 1990s (Ritter, 2025). Annual IPOs have fallen from 845 (1996) to 180 today, with companies under $100 million market cap representing just 10% of offerings versus 40% historically. This collapse blocks growth companies from patient capital while denying retail investors participation in wealth creation.
- 2. Trapped Household Capital: McKinsey research quantifies the substantial economic costs of systematic exclusion from capital formation. The racial wealth gap alone will cost the US economy $1-1.5 trillion between 2019-2028, representing 4-6% of projected GDP (McKinsey & Company, 2019). Currently, nearly half of Black households are unbanked or underbanked, costing $40,000 in fees over a lifetime, while achieving financial inclusion could unlock $60 billion in annual revenue for financial services (McKinsey & Company, 2020). These barriers represent massive economic inefficiencies that constrain growth across the entire economy. Median white household wealth ($285,000) towers over Black household wealth ($44,900), suggesting massive mispricing of creditworthy borrowers (Pew Research Center, 2024). With 26 million credit-invisible adults (see, Consumer Financial Protection Bureau (“CFPB”), Cited in Updated References (hereinafter “Cited”) as Consumer Financial Protection Bureau. (2015)) despite demonstrated payment capacity, the system fails to assess risk efficiently (Consumer Financial Protection Bureau (Cited as Consumer Financial Protection Bureau, 2023, June 29).
- Information Production Breakdown: Over 2,000 public companies lack analyst coverage, creating information asymmetries that favor incumbents. Companies with coverage trade at 15-20% premiums with 40% tighter spreads. Without information production, capital cannot find optimal uses (see Organisation for Economic Co-operation and Development, the “OECD”, cited as OECD. (2023).
“The number of U.S.-listed companies has declined by more than 3,000 since peaking in 1997.”
— Wall Street Journal, Jan. 6, 2017
- Proven Solutions Remain Unscaled: Esusu Financial, Inc. (“Esusu”),[2] a financial technology platform, demonstrates that rent reporting can improve credit scores by 29 points for 34% of unscored participants (Federal Home Loan Mortgage Corporation or “Freddie Mac”, Cited as Freddie Mac. (2024). Community Development Financial Institutions (CDFIs) achieve 2.7% default rates (versus 3.1% mainstream) while serving excluded markets. The technology and frameworks exist, but execution lags (see Freddie Mac. (2024); Federal National Mortgage Association (“Fannie Mae”), Cited as Fannie Mae. (2025); and Federal Housing Finance Agency (“FHFA”), Cited as Federal Housing Finance Agency. (2021).
“Landlords are not required to report rent to credit bureaus, and most do not.”
— Wall Street Journal, Nov. 24, 2021
- Bipartisan Support Already Exists: From Regulation A+ ($14.7 billion raised) to CDFIs ($222 billion in assets), the regulatory framework supports expansion. Both parties recognize that efficient capital allocation serves fundamental American values of opportunity and growth. Historic bi-partisan support for new legislation would allow these expanding companies to have access to the stock exchange national marketplace and liquidity.
[1] Please note the following:
DISCLAIMER
The research, analysis, and information provided in this article are compiled from various third-party sources that Dream Exchange (“DX”) believes to be reliable. However, DX makes no representations or warranties regarding the accuracy, completeness, timeliness, or reliability of any information presented.
This content is provided solely for general informational and educational purposes and does not constitute investment advice, financial recommendations, or official policy statements of DX. Nothing herein should be construed as an offer to buy or sell securities, investment recommendations, or personalized financial guidance.
Past performance does not guarantee future results. All investments carry inherent risks, including potential loss of principal. Individuals should consult with qualified financial advisors, tax professionals, or legal counsel before making investment decisions.
DX expressly disclaims all liability for any direct, indirect, incidental, consequential, or punitive damages arising from the use of or reliance upon this information. By accessing this content, users acknowledge they understand these limitations and agree to hold DX harmless from any claims or losses.
[2] Esusu is discussed in Chapter 4, infra.
* * * *
The economic cost is staggering: $50 billion in foregone small business lending annually, 800,000 jobs not created, and a 15-20% reduction in patent applications. Venture capital allocation shows similar waste—Black founders receive 0.4% of funding despite representing 13% of the population, while 75% of all venture capital firms are concentrated in just three metropolitan areas, in California, New York, and Massachusetts (see, Hart, K. (2020, January 15). Venture capital slowly seeps outside of Silicon Valley. Many companies that might resolve these issues are located in demographic areas like the Midwest.
The choice is not whether we have a need to address these failures, but whether to act strategically now or reactively during the next crisis. Strategic implementation would optimize existing frameworks, scale proven solutions, and establish accountability metrics. The alternative—waiting for market failures to trigger systemic disruption—risks heavy-handed interventions that reduce overall efficiency.
The evidence proves that moral imperatives and economic efficiency align: removing barriers that exclude creditworthy borrowers, capital worthy companies and viable businesses would generate superior returns while creating jobs, building communities, and fostering innovation.
Want to hear directly from our CEO, Joe Cecala, on these topics? Register for our free webinar today: https://event.webinarjam.com/register/280/94yr4f3p
Chapter 1:
When Markets Stop Working
The Disappearing Company Problem
In 1997, American public markets peaked at 7,842 trading companies, creating a vibrant ecosystem where retail investors could participate in growth stories ranging from local regional banks to emerging technology firms (Federal Reserve Board. (2022). By 2016, fewer than 3,627 companies traded on major exchanges, representing a dramatic decline from the peak, with the decrease continuing to affect smaller issuers disproportionately (Doidge , C., Karolyi, G. A., & Stulz, R. M., 2017).
“In the mid-1990s, there were nearly 8,000 public companies listed in the U.S. Today, there are half as many, and at the current rate, we’ll see that number halved again by 2044. The total should have grown dramatically, not shrunk.”
— JPMorgan CEO Jamie Dimon captured the magnitude of this crisis in a 2024 Fortune analysis
The statistics tell the story of systematic market failure. Where once 689 companies went public via an initial public offering (an “IPO”) in a single year (1996), the average in more recent years is just 180 IPOs annually. More troubling, companies under $100 million in market capitalization now represent less than 10% of new public offerings, compared to 40% historically. This shift reflects not investor sophistication but structural barriers that make public markets economically irrational for growth-stage companies (Ritter, 2025, January 5).
“More than 80% of companies that went public since January 1, 2020 are currently trading below their offering price.”
— Fortune Magazine (May, 2024)
Jay Clayton, when he was the SEC Chair, captured the implications succinctly: “To the extent companies are eschewing our public markets, the vast majority of Main Street investors will be unable to participate in their growth. The potential lasting effects of such an outcome to the economy and society are, in two words, not good” (Clayton, J. (2017). When promising companies cannot access public markets efficiently, they face a stark choice—accept suboptimal private valuations or sell prematurely to strategic acquirers. Bloomberg reports that private companies “are raising billions of dollars to delay, and sometimes even shun, a path to public markets,” creating a system where “vast wealth for employees and early-stage stakeholders” remains inaccessible to average investors (Lipschultz, B. (2024).
Consider the economics that drive this dynamic. Research coverage, essential for investor awareness and trading liquidity, costs between $400,000 and $800,000 annually per company. For firms with limited trading volume, expected revenue from commissions and investment banking rarely justifies this expense. The result is a vicious cycle: without coverage, trading remains thin; without trading volume, coverage becomes uneconomical; without either, the company struggles to attract institutional investment or conduct follow-on offerings.
Research documents how this breakdown cascades through the broader economy. Small businesses historically generated 55% of net new employment from 2013 to 2023, with their role increasing to over 70% of net job creation since 2019 (Bureau of Labor Statistics, (2024, May 3); U.S. Department of the Treasury. (2024, December 18). Additionally, smaller companies performing R&D demonstrate higher innovation intensity, with an R&D-to-sales ratio of 10% and employing 18% of all business R&D workers despite their smaller size (National Science Foundation.(2021, November 18).When the pathway to public markets becomes blocked for smaller firms, the entire innovation pipeline suffers.
The Information Production Crisis
The collapse of research coverage represents more than an inconvenience for small companies—it signals fundamental market failure in price discovery and capital allocation. Markets work efficiently when information flows freely, allowing capital to find its highest value uses. When information production breaks down, capital misallocation inevitably follows.
Research consistently demonstrates that analyst coverage creates significant market advantages for public companies. Academic studies have found that companies with analyst coverage experience improved stock liquidity, as measured by trading volume and bid-ask spreads (See, e.g., Roulstone, D.T. (2003) and Hong, H., Lim T., & Stein, J.C. (2000)) documented that stocks with no analyst coverage exhibit significantly slower information diffusion, leading to momentum effects and delayed price reactions to earnings news. Brennan M.J. & Subrahmanyam, A. (1995) found that institutional ownership is positively correlated with analyst following, as institutions rely heavily on research for investment decisions and often have policies requiring analyst coverage before making investments. The cumulative effect creates a two-tiered market where covered companies benefit from enhanced liquidity, broader institutional participation, and more efficient price discovery, while uncovered companies face systematic disadvantages that compound over time (Derrien, F. & Kecskés, A. (2013).
The post-2008 regulatory reforms, while necessary for systemic stability, inadvertently worsened the coverage crisis. Academic research extensively cited in financial publications demonstrates that “[t]he Sarbanes-Oxley Act imposed disproportionally large, fixed costs for small firms going public,” (see, e.g., Chhaochharia, V. & Grinstein, Y. (2007); Holmstrom, B. & Kaplan, S.N. (2003); Morgenstern,R. & Nealis, T.J.,(2004); Zhang, I.X. (2007) with compliance costs representing “4.3% for a median US public company” (Ewens M. & Xiao, K. (2024)). Compliance under the Dodd-Frank Act has imposed substantial implementation costs on financial institutions, with the banking system experiencing an estimated $64.5 billion annual increase in noninterest expenses following the Dodd-Frank Act’s passage, including $12.42 billion in additional legal fees and $7.04 billion in data processing costs for large banks (Feldman, R. (2019)).
The National Market System Tick Size Pilot Program, conducted from 2016 to 2018, provided a natural experiment in whether mechanical rule changes could restore small-cap market functioning. Selected stocks had their minimum trading increments widened from one cent to five cents, with the goal of improving market maker economics and encouraging research coverage. The results were instructive – spreads widened as intended, but benefits proved to be temporary as overall trading volume declined five (5%) to eight (8%) percent thereafter. No measurable improvement in IPO activity or analyst coverage followed (OECD. (2023)).
“The IPO window has ‘slammed shut’—then opened ‘at least a crack.'”
— Wall Street Journal, June 8, 2024
The failure of mechanical fixes highlighted a deeper truth: capital markets are information markets first and trading markets second. Allowing access to capital markets and increasing the free marketplace to more firms provides public information which is needed alongside technical adjustments. Without addressing the fundamental economics of information production, rule changes remain cosmetic. As then SEC Chair Jay Clayton noted in his 2017 Economic Club remarks, the SEC’s mission includes facilitating capital formation, and ‘vibrant equity markets underpin capital formation in many ways, including by facilitating the raising of equity capital by public companies and by providing valuable information – think price discovery through comparable metrics – about a company’s value.’ (Clayton, J. (2017)).
Want to hear directly from our CEO, Joe Cecala, on these topics? Register for our free webinar today: https://event.webinarjam.com/register/280/94yr4f3p
Chapter 2:
The Foundation Cracks – Where Capital Access Begins to Fail
The Household Wealth Allocation Problem
Capital markets don’t exist in isolation—they rest on a foundation of household balance sheets and credit access. When that foundation becomes inefficient at assessing and pricing risk, the entire system’s resource allocation suffers. The Federal Reserve’s Survey of Consumer Finances reveals patterns that suggest significant mispricing in credit markets (Brookings Institution. (2024)).
The wealth stratification data reveals market dysfunction rather than mere demographic differences. When median white household wealth reaches $285,000 while median Black household wealth remains at $44,900, the gap suggests that capital markets are failing to efficiently assess and serve creditworthy borrowers and capital worthy firms across different communities (Pew Research Center. (2024)). This is not about equal outcomes—it is about equal access to risk-appropriate pricing for credit and capital formation products.
These gaps translate directly into reduced market efficiency. While 61% of white families own equities directly or through retirement accounts, only 34% of Black families participate in stock markets (ibid).The difference represents not just individual disadvantage but collective economic inefficiency — millions of potential savers and investors remain outside the system that could benefit from their capital while providing them wealth-building opportunities.
The Federal Depository Insurance Company’s (“FDIC’s”) 2023 National Survey documents how exclusion begins with basic banking access. Despite decades of financial inclusion efforts, 5.6 million households remain completely unbanked, with another 17 million classified as underbanked—relying on check cashers, payday lenders, and other high-cost alternatives for basic financial services (Federal Deposit Insurance Corporation. (2025).
The Federal Reserve’s research reveals alarming geographic patterns in this exclusion. The “Fed Communities” (a collaboration among the Board of Governors and all 12 Reserve Banks of the Federal Reserve System) Banking Deserts Dashboard data shows, “from 2019 to 2023, the total number of bank branches declined by 5.6 percent, the number of banking deserts increased by 217, and the number of Americans living in banking deserts grew by 760,000” (see Federal Reserve Bank of Richmond. (2024). The demographic concentration is stark: The Federal Reserve Bank of Atlanta’s (the “Atlanta Fed”) research found that, “among tracts with majority American Indian and Alaska Native populations, an eye-popping 46.4 percent of residents live in banking deserts—more than 12 times the national average” (Federal Reserve Bank of Richmond, 2024).
“Black households represented about 12.9% of households overall but made up 32.3% of unbanked households.”
- FDIC, 2025
The Community Reinvestment Coalition’s Jesse Van Tol summarized the structural transformation on Bloomberg TV: “18,000 institutions down to 5,000. The trend line continues… We’ve seen dozens of banking deserts crop up, especially in rural places and underserved markets and minority communities”. (Federal Reserve Bank of Richmond, 2024).
Without bank accounts, households cannot build the documented financial histories that underpin mortgage applications, small business loans, or investment account openings. The exclusion compounds over generations, creating entire communities effectively locked out of wealth-building opportunities that middle-class Americans take for granted.
Mortgage Markets: Where Discrimination Becomes Documented
The Home Mortgage Disclosure Act dataset provides the most comprehensive documentation of systematic credit barriers in American finance. With 10 million mortgage applications reported annually by 5,113 financial institutions, the data reveals patterns that persist despite decades of fair lending laws and regulatory oversight (see Consumer Financial Protection Bureau. (2024) and Consumer Financial Protection Bureau. (2025).
The denial rate differentials tell a stark story. Black applicants face a 16.6% denial rate compared to 5.8% for non-Hispanic White applicants—a gap that has remained remarkably consistent across different economic cycles and interest rate environments. Hispanic applicants see 12.0% denial rates, while Asian applicants experience 9.0% denials (Consumer Financial Protection Bureau. 2024). These differences persist even when controlling for credit scores, income levels, debt-to-income ratios, and property characteristics.
Federal Reserve researchers Neil Bhutta, Aurel Hizmo, and Daniel Ringo conducted the most comprehensive analysis of mortgage bias using 2018-2019 data, controlling for every traditional underwriting factor available in the regulatory dataset (Bhutta N., Hizmo, A., & Ringo, D. (2022). Their findings fundamentally challenge assumptions about algorithmic objectivity in lending. Even when mortgage applications are processed through automated underwriting systems—designed to eliminate human bias—Black and Hispanic applicants receive less favorable recommendations than white applicants with identical financial profiles.
The researchers quantified the unexplained portion of denial rate gaps at 40-50% after comprehensive controls, representing systematic bias that cannot be attributed to legitimate risk factors. More troubling, they documented how this bias translates into pricing discrimination, with Black and Hispanic borrowers paying 3-9 basis points higher interest rates even when approved for mortgages (See Bhutta N., Hizmo, A., & Ringo, D., 2022).
The Federal Housing Finance Agency’s (the “FHFA”) analysis of property appraisals adds another layer to the discrimination story. Using the Uniform Appraisal Dataset, FHFA researchers found that appraisers use time adjustments—critical for capturing recent market appreciation—far less frequently in majority-Black neighborhoods. In white-majority areas, 18.4% of appraisals included time adjustments compared to just 13.4% in Black-majority areas (Susin, S. (2024)). This seemingly technical difference has profound consequences: appraisals in minority neighborhoods are 12% more likely to fall below contract price, forcing buyers to increase down payments or abandon purchases entirely.
“VantageScore gets the green light for use in mortgages.”
— Wall Street Journal, July 9, 2025
Then CFPB Director Rohit Chopra’s enforcement actions provide concrete examples of how cultural bias operates within large financial institutions. The 2023 Citibank case revealed that senior management systematically discriminated against Armenian Americans applying for credit cards, with employees instructed to deny applications based on surname patterns ending in “-ian” or “-yan.” As Chopra stated in announcing the $25.9 million settlement, “Citi stereotyped Armenians as prone to crime and fraud, and employees concealed the real basis for denials” (Consumer Financial Protection Bureau. (2023, November 8)).
Small Business Credit: Systematic Mispricing of Entrepreneurial Risk
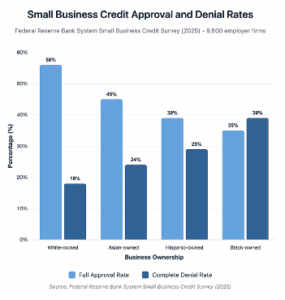
The Federal Reserve’s Small Business Credit Survey provides an annual snapshot of how inefficient risk assessment affects the entrepreneurial foundation of economic growth. The 2023 results, based on responses from 6,000 employer firms across all Federal Reserve districts, document systematic differences that suggest significant mispricing in business credit markets (Federal Reserve Banks, 2024).
Among firms that sought credit in the past year (37% of all employer businesses), approval patterns reveal what appears to be market inefficiency in risk assessment. Older, larger, and white-owned firms were more likely than their counterparts to be fully approved for a loan, line of credit, or merchant cash advance in the 12 months prior to the survey. (Federal Reserve Banks, 2024).
These gaps persist despite remarkable similarity in the underlying credit requests, suggesting the differentials reflect assessment problems rather than actual risk differences. Average loans requested across demographic groups had nearly identical purposes: working capital, equipment purchases, and business expansion. Industry distributions show minimal variation, and geographic analysis reveals that disparities persist within the same metropolitan areas (Federal Reserve Banks. (2024)).
The economic implications are substantial. Recent research from the University of Washington’s Foster School of Business reveals significant credit allocation disparities that impose substantial costs on minority-owned businesses. Minority-owned businesses collectively bear an additional $8 billion in interest costs annually, with Black-owned businesses charged 3.09 percentage points more in interest, Hispanic-owned firms paying an additional 2.91 percentage points, and Asian-owned firms facing a 2.88 percentage point penalty compared to white-owned businesses, even after controlling for creditworthiness and comparable firm characteristics (Bradford, W.D., & Verchot, M (2024)).
Additional research demonstrates that minority-owned firms are significantly more likely to be denied loans, with denial rates for minority firms about three times higher at 42 percent compared to 16 percent for non-minority-owned firms among smaller businesses, and nearly twice as high for larger firms (Fairlie & Robb, 2010). These disparities extend beyond interest rates to loan amounts, with minority-owned firms receiving substantially smaller loans – averaging $149,000 compared to $310,000 for non-minority firms among high-sales businesses (Fairlie, R.W., & Robb, A.M. (2010)).
“Black entrepreneurs received less encouragement to apply for a loan and were more frequently steered toward alternative loan products compared to white shoppers with similar or weaker business credit profiles.”
— 2024 CFPB Director Rohit Chopra’s 2024 secret shopping study
The CFPB’s comprehensive analysis found that lenders “expressed interest in applications from 40% of white participants, but only 23% of Black participants” in controlled testing scenarios. (Consumer Financial Protection Bureau. (2023, June 29). This represents systematic steering that cannot be explained by legitimate risk factors, indicating pure market inefficiency in credit allocation.
The venture capital industry, often celebrated as America’s innovation financing engine, reflects the same systematic allocation inefficiencies observed in traditional credit markets. Despite representing the most dynamic sector for job creation and technological advancement, the Venture Capitalist’s (the “VCs”) allocation patterns show persistent concentration that suggests significant mispricing of entrepreneurial opportunities.
TechCrunch’s 2024 analysis revealed staggering geographic concentration: “Bay Area startups vacuumed up $90 billion of VC investment in 2024, which was 57% of the $178 billion of US venture funding.” (Bort, 2025). Research by Ian Hathaway demonstrates that “Venture capitalists are nearly 50 percent more concentrated than are venture deals,” indicating systematic overallocation to specific geographic clusters rather than optimal risk-adjusted returns. (Hathaway, 2020).
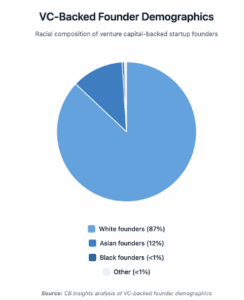
The demographic allocation patterns are even more striking and contradictory to performance data. McKinsey data shows, “Black and Latino founders received only 1 percent and 1.5 percent respectively of total US venture capital funding” in 2022, while “women-founded teams received 1.9 percent of VC funds” (Davis, D.M. (2023))
“Companies with a female founder performed 63% better than our investments with all-male founding teams” — First Round Capital’s 10-year data analysis
These allocation patterns directly contradict performance data, suggesting systematic mispricing rather than merit-based selection. The World Economic Forum estimates that, “global GDP would rise 3% to 6%, boosting the global economy by up to $5 trillion annually if women entrepreneurs received the same investment as male entrepreneurs.” (Unnikrishnan, S. & Blair, C. (2019).
The concentration problem is worsening due to institutional consolidation. Financial media reports show, “The total number of VCs investing in US companies fell to 6,175 in 2024, down from 8,315 in 2021,” with “over half of the $71 billion raised by US venture firms in 2024” flowing to “just nine major players.” (Pitchbook, 2024).
Want to hear directly from our CEO, Joe Cecala, on these topics? Register for our free webinar today: https://event.webinarjam.com/register/280/94yr4f3p
Chapter 3:
The Human Cost of Market Failure
Banking While Muslim: When Compliance Creates Exclusion
The story of financial exclusion extends beyond traditional demographic categories to encompass religious and cultural identity. The Institute for Social Policy and Understanding’s (the “ISPU”) comprehensive national survey documented banking frictions that affect Muslim Americans at nearly twice the rate of the general population—27% reporting challenges with financial institutions compared to 12% nationally. (Chouhoud, Y., (2023)).
These are not abstract statistics but real barriers affecting business formation and community development. Muslim business owners report account problems at a 31% rate, while nonprofit leaders describe difficulties obtaining and maintaining organizational accounts at a 41% rate. (Id). The frictions manifest in multiple ways: Muslim Americans report banking challenges at nearly twice the rate of the general population (27% vs. 12%), with personal bank accounts placed under investigation more than twice as frequently (29% vs. 14% general public). For nonprofit organizations, the disparities are even starker, with Muslim-affiliated nonprofits experiencing challenges at rates nearly four times higher than organizations in the general population (62% vs. 17%) (Chouhoud, Y. (2023)).
The economic impact was immediate and devastating. Somali diaspora communities had sent $215 million annually to Somalia, representing an average of $200 monthly per household—often 30% of recipient family income (World Bank, 2016). These flows funded not just basic needs but micro-enterprises, education, and healthcare in one of the world’s most challenging environments.
Federal enforcement actions reveal how cultural profiling operates within risk management systems. The US Treasury Department’s (“Treasury”) 2023 De-Risking Strategy acknowledged that financial institutions often terminate “entire categories of customers instead of applying risk-based due diligence,” pushing lawful activity out of regulated channels while failing to improve actual security outcomes. (See, e.g., AML RightSource. (2023); Financial Action Task Force. (2025); and World Bank. (2016)).
The regulatory framework explicitly prohibits such categorical exclusions. Joint guidance from the Federal Reserve System (“Federal Reserve”), Federal Deposit Insurance Corporation (the “FDIC”), Financial Crimes Enforcement Network (“FinCEN”), National Credit Union Administration (“NCUA”), and the Comptroller of the Currency (“OCC”) emphasizes customer-specific risk assessments rather than blanket restrictions based on industry, geography, or demographic characteristics. Yet implementation often defaults to broad exclusions that sweep in lawful customers alongside legitimate compliance concerns.
The 2015 Somali Remittance Crisis: A Case Study in Systemic Failure
The disruption of Somali remittance services in 2015 provides a concrete example of how indiscriminate de-risking can devastate lawful economic activity while achieving no meaningful security benefits. The timeline reveals how fear-based compliance decisions can destroy economic ecosystems built over decades. (See e.g., AML RightSource, (2023); Financial Action Task Force. (2025); and World Bank. (2016)).
Between 2010 and 2014, major American banks gradually exited correspondent relationships with Somali-focused money service businesses, citing regulatory uncertainty and reputational risk. By February 2015, Merchants Bank of California—the final major provider maintaining these relationships—announced its exit from the Somali market (World Bank, 2016). Reuters reported that “virtually all major U.S. banks” had abandoned the Somali remittance corridor despite the complete absence of regulatory violations or sanctions enforcement against the sector.
The economic impact was immediate and devastating. Somali diaspora communities had sent $215 million annually to Somalia, representing an average of $200 monthly per household—often 30% of recipient family income (World Bank. (2016)). These flows funded not just basic needs but micro-enterprises, education, and healthcare in one of the world’s most challenging environments.
Community leaders and development organizations warned of “catastrophic effects” as legitimate financial flows were forced into unregulated channels. The cost of sending money increased 340% through informal networks, while recipient families lost access to documented transaction records needed for their own credit building and business development (World Bank. (2016)).
The innovation pipeline suffered equally severe disruption. Diaspora-funded technology startups in Minneapolis, Seattle, and other Somali-American communities saw a 45% reduction in available capital as entrepreneurs could no longer access family resources for business formation (Chouhoud, Y. (2023)).
Market recovery efforts began in 2016 as Treasury and Federal Reserve agencies issued clarifying guidance, but the damage proved difficult to reverse. CDFIs entered the market gap, while blockchain-based remittance platforms emerged to provide technological solutions. By 2019, the corridor had recovered 78% of pre-crisis volume, but trust in traditional banking relationships never fully returned.
Gaza Humanitarian Aid: When Compliance Blocks Charity
The October 7, 2023 Hamas attacks on Israel triggered another wave of banking restrictions that illuminated how fear-based compliance can impede lawful charitable activity. Major media outlets documented systematic challenges faced by humanitarian organizations attempting to provide aid to Gaza’s civilian population through established legal channels.(Sun, M. (2024)).
The Wall Street Journal‘s August 2024 investigation revealed how these banking challenges affected even the largest, most established aid organizations. Groups with explicit government authorization for humanitarian operations found themselves unable to transfer funds for food, medical supplies, and emergency relief services.
The human consequences of banking restrictions on humanitarian operations have been significant and well-documented. Financial access difficulties affect approximately two-thirds of non-profit organizations operating internationally, with these barriers increasing substantially in both frequency and scope (Mackintosh, K. & Duplat, P. (2013)).
The Government Accountability Office’s (the “GAO”) 2021 analysis found that organizations serving high-risk geographies experience significant banking access challenges, including account closures, delays or denials of fund transfers, fee increases, refusal to open new accounts, and elevated compliance costs when working with financial institutions (Government Accountability Office. (2021))
Armenian Americans and Algorithmic Bias
The CFPB’s enforcement action against Citibank (and the consent order that it had entered into thereafter) provides documented evidence of how cultural bias operated within a major financial institution. The $25.9 million settlement revealed systematic discrimination against Armenian Americans that occurred from at least 2015 through 2021 (Consumer Financial Protection Bureau. (2023)).
The discrimination was implemented through manual underwriting processes where employees specifically targeted applicants with surnames ending in “-ian” or “-yan,” particularly those residing in or around Glendale, California, for enhanced scrutiny and denial. Employees were instructed to conceal this discriminatory practice and provide false reasons for denials in adverse action notices (ibid).
Senior management involvement distinguished this case from typical compliance failures. Leadership remarks cited in the CFPB consent order revealed explicit stereotyping of Armenian Americans as “prone to crime and fraud.” Employees received instructions to provide pretextual denial reasons while concealing the role of ethnicity in decision-making.
The affected community responded predictably to systematic exclusion, with Armenian Americans beginning to avoid mainstream banks following widespread reports of discrimination (ibid).
Want to hear directly from our CEO, Joe Cecala, on these topics? Register for our free webinar today: https://event.webinarjam.com/register/280/94yr4f3p
Chapter 4:
Solutions at Scale – The Esusu Story
The $2.3 Trillion Data Gap
Among the most striking inefficiencies in American credit markets is the systematic exclusion of rent payment data from credit files. Despite rent representing the single largest monthly expense for millions of American households, fewer than 3% of the nation’s 77 million renters have rental payment data reflected in their credit reports (See Pang, D., Goodman, L. and Choi, J. (2025), citing Ethan Doran of FICO).
The Urban Institute’s analysis revealed the scale of this market failure through partnerships with financial technology companies. Research using Esusu’s rent reporting data found that previously unscored consumers typically received prime VantageScores after 12 months of positive payment reporting, with average scores of 676 for those with 12 months of data (Reynolds, L. ( 2025). For many renters, particularly young adults and recent immigrants, rent payments represent their most substantial and consistent demonstration of repayment capacity.
This data gap intersects directly with documented wealth and credit disparities. The CFPB’s research on credit invisibility shows 26 million adults lack any credit history, with an additional 19 million having insufficient data for traditional scoring (Brevoort, K., Grimm, P., & Kambara, M. (2015)). Demographic concentration is stark: Fifteen percent (15%) of Black and Hispanic consumers are credit invisible compared to just nine percent (9%) of White consumers (Consumer Financial Protection Bureau, (2015)).
For households that rent rather than own (disproportionately Black and Hispanic households), the inability to monetize their largest monthly payment creates a systematic barrier to credit building that compounds over generations. According to the Urban Institute analysis, Black renter households comprise 16.1% of all renter households with 12 months of on-time payments, while representing 12.2% of households overall, suggesting positive payment reporting could help reduce racial homeownership gaps (Reynolds, L. (2025)).
Enter Esusu: Technology Meets Policy Innovation
Esusu’s emergence as a billion-dollar company reflects more than successful entrepreneurship, it demonstrates how targeted technology can address systematic market failures when combined with appropriate policy support. Founded by Nigerian immigrants Abbey Wemimo and Indian American Samir Goel, the company identified rent reporting as both a technical challenge and a market opportunity (Kene-Okafor. (2022)).
The business model elegantly addresses multiple stakeholder interests simultaneously. Property management companies gain a tenant retention tool, as renters with improving credit scores are less likely to move frequently. Credit bureaus receive new data streams that improve their risk models’ accuracy. Government-sponsored enterprises benefit from better underwriting data that reduces default risk while expanding access.
Esusu’s technology integration with property management systems captures rental payment data and reports it to credit bureaus to boost credit scores, helping property owners mitigate eviction risks through differentiated data and insights (Esusu Financial Inc., (2022)). The opt-in model protects consumers while serving over 2.5 million rental units across all 50 states.
The growth trajectory reflected market validation. The company demonstrated 600% year-over-year growth, serving over 2.5 million homes representing over $3 billion in Gross Lease Volume across the United States (Kene-Okafor. (2022)).The 2022 Series B round brought $130 million from SoftBank Vision Fund 2, valuing the company at $1 billion and establishing it as one of the few, Black-founded unicorns in American business (ibid).
Government Partnership: When Policy Enables Innovation
Esusu’s scale required more than private investment—it needed policy infrastructure that could support systematic rent reporting across millions of rental units. The alignment with government-sponsored enterprises proved crucial for achieving the scale necessary to impact credit markets meaningfully.
Esusu announced a joint initiative with The Federal Home Loan Mortgage Company (also known as “Freddie Mac”) in November 2021, providing closing cost credits to borrowers using the rent reporting service (Esusu Financial Inc. (2023). In less than two months, the program helped establish credit scores for more than 6,000 people and improved scores for previously scorable consumers by an average of 43 points (Stegman, M., & Cochran, K. (2022)).
The policy design reflected careful attention to consumer protection concerns. Esusu automatically unenrolls tenants when they miss a payment to avoid impairing their records, though they may reenroll after six months (Reynolds. (2022)). This “positive-only” approach aligns with consumer advocacy recommendations that consumers are better off with no scores than low scores, which can impede access to rental housing, employment, and insurance (ibid).
The Federal Housing Administration (“FHA”) has required lenders to report positive rental payment history in its Technology Open to Approved Lenders (TOTAL) Mortgage Scorecard since March 2023 (Pang, D., Goodman, L & Choi, J.H. (2025)). This represents a significant policy shift toward incorporating alternative data in mortgage underwriting.
Measured Impact: The Randomized Trial Evidence
The Urban Institute’s randomized evaluation provides rigorous evidence of rent reporting effectiveness, addressing academic concerns about selection bias that often complicate financial inclusion research (Theodos, B., Teles, D, & Liberman, S. (2025)). The study design followed experimental protocols with 269 renters divided into treatment and waitlist control groups. The treatment group could have rent reported immediately, while the waitlist group waited four months (ibid).This design allowed researchers to isolate the causal effects of rent reporting.
The results validated the theoretical case for alternative data inclusion. Positive-only rent reporting led to statistically significant increases in the likelihood of having a credit score using VantageScore, which scores more people and responds more quickly to new accounts than those who utilized Fair Isaac Corporation (FICO) scores (ibid). The share of the treatment group without credit scores was cut in half, from 16% to 8%.
The study found that rent reporting increased the likelihood of having at least a “near-prime” score (VantageScore of at least 601) by an estimated 12 percentage points (ibid.). Among those whose rents were reported, the share with near-prime scores or better increased by 25 percentage points.
The New York City Comptroller’s analysis provided additional validation using consumer profile data provided by the credit agency, Experian. The study found that 76% of New York City renters who currently hold a credit score would see increases if rent were reflected in credit files, with 57% seeing increases of one to ten points and 19% seeing increases of eleven points or more (Stringer, S.M. (2017)).
Consumer Protection as Competitive Advantage
Esusu’s implementation demonstrates how consumer protection can serve as a competitive differentiator rather than regulatory burden. The positive-only reporting model addresses fair lending concerns while creating stronger value propositions for both tenants and property owners.
Research shows that full-file reporting, which captures both on-time and missed payments, risks further exacerbating low credit scores during periods of delinquency (Urban Institute). Positive rent reporting protects against this risk by ensuring only on-time payments are counted, which explains why consumer advocacy groups support this approach.
California’s Senate Bill (SB) 1157, effective since July 2021, represents one of the first major state-led initiatives requiring private landlords with fifteen or more subsidized housing units to allow tenants to opt into rent reporting at a cost of no more than ten dollars ($10) per household (Urban Institute, 2023).
The dispute resolution and accuracy standards exceed industry norms, while the opt-in design ensures consumer choice and protection during financial distress. These features position rent reporting as a tool for financial empowerment rather than potential harm.
Want to hear directly from our CEO, Joe Cecala, on these topics? Register for our free webinar today: https://event.webinarjam.com/register/280/94yr4f3p
Chapter 5:
Building the Future –
Strategic Solutions for Market Efficiency
Unlocking Existing Infrastructure: The Underutilized Pathways
American capital markets already possess sophisticated infrastructure for expanding access; the challenge lies in optimization rather than reconstruction. Regulation A+ and Regulation Crowdfunding represent carefully designed frameworks that balance investor protection with capital formation needs; yet these regulations remain dramatically underutilized for capital formation relative to their potential. Additionally, a controlled marketplace for secondary liquidity for these offerings has not been created.
Since May 16, 2016, Regulation Crowdfunding has facilitated approximately $1.3 billion in capital formation across more than 3,800 offerings where issuers reported proceeds through December 31, 2024 (Securities and Exchange Commission, Division of Economic and Risk Analysis. (2025). Analysis of crowdfunding under the JOBS Act). While this represents meaningful progress, the scale remains modest compared to other capital formation methods. The disparity reflects not inherent limitations but regulatory frictions that discourage broader adoption.
The 2020 harmonization significantly improved the framework by raising annual limits from $1.07 million to $5 million while adjusting investor restrictions. These changes increased average successful raises to approximately $346,000 (ibid). Geographic distribution provides encouraging signs, with analysis indicating that many issuers operate outside traditional financial centers, demonstrating the framework’s potential for broadening capital access.
Regulation A+ shows even greater underutilization relative to capacity. The two-tier structure allows raises up to $20 million (Tier 1) or $75 million (Tier 2) annually, with federal preemption of state qualification for Tier 2 primary sales. Since 2015, companies have raised approximately $9.4 billion through more than 1,400 Regulation A offerings, with average raises varying by tier (Securities and Exchange Commission, Division of Economic and Risk Analysis, (2025). Analysis of the Regulation A market: A decade of Regulation A.).
SEC Commissioner Hester Peirce’s reform agenda identifies specific friction points limiting broader adoption. Secondary market liquidity restrictions discourage investor participation by limiting trading opportunities after initial purchase. State qualification requirements for Tier 1 and secondary trading create compliance complexity that favors larger issuers with sophisticated legal resources. Streamlined ongoing reporting could reduce operational burdens while maintaining appropriate transparency. The creation of custom marketplace infrastructure under new legislation may both enhance reporting integrity and secondary liquidity, encouraging more investor participation in these smaller offerings.
The policy foundation exists for addressing these limitations through targeted regulatory adjustments rather than wholesale framework revision. Extending federal preemption to secondary trading would eliminate state-by-state compliance requirements that currently fragment investor markets. Reducing the one-year trading restriction for crowdfunding securities to six months would improve liquidity while maintaining reasonable cooling-off periods.
Community Development Financial Institutions: Proof of Concept at Scale
The CDFI sector provides compelling evidence that specialized expertise can overcome systematic market barriers while maintaining risk discipline and competitive returns. With more than $222 billion in total assets managed by more than 1,400 certified CDFIs nationwide, the sector has achieved sustainable scale while serving markets that traditional institutions often avoid (Opportunity Finance Network. (2022)). Recent data indicates the industry has experienced remarkable growth, with assets tripling since 2018 and the number of CDFI-certified entities rising by 40 percent (Federal Reserve Bank of New York (2023)).
The specialized underwriting capabilities help explain performance in underserved markets. CDFIs integrate alternative data sources, such as cash flow analysis, community references, and industry-specific expertise that traditional credit models may overlook. Flexible collateral policies accept inventory, equipment, and receivables that conventional lenders might reject. Most importantly, relationship banking approaches create long-term partnerships that extend beyond individual transactions.
Recent innovations demonstrate how CDFIs can leverage technology while maintaining their community focus. Many CDFIs now partner with fintech companies for enhanced data analytics and offer digital application and servicing systems. Blockchain pilots in remittances and trade finance show potential for addressing correspondent banking gaps that have limited international economic development.
The CDFI Fund’s leverage ratios provide compelling evidence of public-private partnership effectiveness. Every dollar of federal support mobilizes multiple dollars in private capital, creating sustainable institutions that continue generating economic impact long after initial capitalization. Recent award cycles have distributed millions to hundreds of organizations, supporting affordable housing units and job creation (CDFI Fund. (2024)).
Bipartisan congressional support reflects recognition of demonstrated effectiveness. Recent joint statements from senators have emphasized CDFIs’ success in mobilizing private capital in underserved markets while providing critical infrastructure for non-metropolitan business development (Warner, Mark R. (2025)). This political foundation supports expansion of successful models rather than experimental programs with uncertain outcomes.
Opportunity Zones: Market Mechanism with Accountability
Place-based investment tools like Opportunity Zones can effectively channel private capital to underserved communities when structured with appropriate transparency and accountability measures. The $75 billion in commitments since 2018 demonstrates investor appetite for tax-advantaged community development investments (Council of Economic Advisers, (2020)).
The performance data shows meaningful economic impact alongside competitive returns. Analysis indicates direct employment creation in designated zones, with wages above local medians, suggesting successful targeting of investment toward productive uses. Local hiring rates and workforce training components in projects demonstrate community engagement rather than mere capital placement.
Geographic distribution across metropolitan areas, small cities, and rural communities shows broad applicability beyond major urban centers. Housing units developed or preserved, commercial space created, and infrastructure improvements represent tangible community development outcomes that extend beyond immediate job creation (ibid).
However, the program’s effectiveness depends critically on measurement and accountability frameworks that ensure investor incentives align with community needs. Standardized outcome reporting requirements would enable systematic evaluation of program effectiveness while identifying best practices for replication. Community benefit thresholds could ensure that tax incentives generate proportionate local economic impact.
The bipartisan political foundation provides stability for program enhancement. President Trump’s characterization of the initiative as cherishing and renewing American communities established Republican support, while state implementation by governors from both parties demonstrates broad political acceptance. Emphasis on economic development effectiveness shows state-level commitment to outcome-focused implementation.
Technology Integration: The Algorithmic Underwriting Revolution
Advances in machine learning and alternative data analysis offer pathways to expand credit access while improving rather than compromising risk management standards. The algorithmic small business lending market demonstrates that technology-enabled underwriting can serve previously excluded borrowers while maintaining portfolio quality.
The key lies in responsible implementation that combines technological capability with appropriate oversight. Successful models integrate multiple data sources, including cash flow patterns, payment histories, and supply chain relationships to create multidimensional risk assessments that capture creditworthiness invisible to traditional approaches.
Fair lending compliance requires careful attention to algorithmic bias prevention. Regular model auditing, diverse training datasets, and explainable AI approaches ensure that expanded access does not inadvertently create new forms of discrimination. Leading practitioners conduct disparate impact testing throughout development and deployment, adjusting models when demographic disparities emerge without legitimate risk justification.
The competitive advantages of early adoption are substantial. Institutions that develop sophisticated alternative data capabilities can identify undervalued lending opportunities before competitors recognize their potential. First-mover advantages include proprietary datasets, refined algorithms, and established customer relationships in underserved markets that create sustainable competitive moats.
Want to hear directly from our CEO, Joe Cecala, on these topics? Register for our free webinar today: https://event.webinarjam.com/register/280/94yr4f3p
Chapter 6:
The Regulator’s Dilemma – Safety, Innovation, and Inclusion
Balancing Act: When Good Intentions Create Market Failures
Financial regulators face an increasingly complex challenge: maintaining system safety and soundness while enabling innovations that can expand access and improve market efficiency. The post-2008 regulatory framework, designed to prevent systemic collapse, has inadvertently created barriers that limit credit access for creditworthy borrowers and viable businesses.
The compliance cost burden illustrates this regulatory dilemma clearly. Current studies indicate that the Sarbanes-Oxley (“SOX”) Section 404(b) compliance costs continue to rise, with recent analysis showing that, even two decades after implementation, compliance costs have not fallen significantly (Protiviti. (2022)). According to the GAO’s 2025 report on SOX compliance, costs are higher for larger companies but more burdensome for smaller ones (Government Accountability Office. (2025)). These expenses, reasonable for large institutions with diversified revenue streams, become prohibitive for smaller entities that lack economies of scale to absorb fixed regulatory costs.
Community banks provide the clearest example of unintended consequences. Institutions with assets under $10 billion face the same basic compliance requirements as money-center banks, despite lacking dedicated compliance departments and sophisticated risk management systems. The result has been steady industry consolidation, with the number of commercial banks declining from 30,456 in 1921 to only 4,377 at the end of 2020, representing an 86% decrease (Federal Reserve Bank of St. Louis. (2021)). Even since 1934, after the FDIC stabilized the banking system, the bank population has declined by 71%, or 10,973 institutions (ibid.).
The consolidation matters for credit access because community banks traditionally served markets that larger institutions found unprofitable. Small business lending, agricultural finance, and community development projects depend on relationship banking approaches that require local market knowledge and flexible underwriting standards. As community banks merge or fail, these specialized lending functions disappear or migrate to CDFIs with limited capacity.
European regulatory experiences provide cautionary examples of well-intended reforms creating market distortions. MiFID II research unbundling requirements, which are designed to: (i) improve transparency in investment research costs and significantly reduced coverage of smaller European companies, as institutional investors reduced research budgets (Fu et al., 2024; Guo & Mota, 2021). Research examining the aggregate market impact found that unbundling resulted in “a much stronger negative impact on information quantity on the LSE [London Stock Exchange] Main Market (the “LSE MM”), both for large caps and SMEs” while paradoxically improving analyst coverage on Alternative Investment (“AIM”) markets (Fu, X., Hasan, I., & Petrella, G. (2024)). This means that on the LSE MM, separating research costs from trading commissions reduced the overall volume of available information for both large companies and smaller firms, while it unexpectedly led to more analysts following listed businesses on the AIM. The regulation achieved its transparency objective while inadvertently harming the very companies that most needed analyst attention for efficient capital allocation.
The Innovation Sandbox Approach
Regulatory sandboxes offer promising approaches for enabling financial innovation while maintaining appropriate oversight and consumer protection. The United Kingdom’s Financial Conduct Authority pioneered this approach, allowing fintech companies to test new products and services with relaxed regulatory requirements for limited time periods and customer populations.
The sandbox benefits work both directions. Innovative companies gain certainty about regulatory expectations while testing market viability without full compliance costs. Regulators observe new business models in controlled environments, learning about risks and benefits before making permanent policy decisions. Consumers gain access to new financial services with appropriate protections against systemic exposure.
American regulatory agencies have begun experimenting with similar approaches. The OCC’s fintech charter provides national bank powers for technology companies meeting enhanced standards for consumer protection and community benefit. State regulators have created expedited licensing processes for companies demonstrating innovative approaches to underserved market segments.
The CFPB’s approach to alternative data represents regulatory thinking about balancing innovation and protection. Rather than prohibiting new data sources, federal regulators, in an interagency statement, have provided guidance emphasizing accuracy, privacy, and appropriate use while encouraging responsible innovation. This framework enables beneficial uses like rent reporting while preventing discriminatory applications (See Joint Statement by the Federal Reserve Board, Consumer Financial Protection Bureau, Federal Deposit Insurance Corporation, Office of the Comptroller of the Currency, & National Credit Union Administration. (2019)).
However, sandbox approaches require careful design to avoid regulatory capture or race-to-the-bottom competition between jurisdictions. Clear graduation criteria ensure that successful innovations eventually meet full regulatory standards rather than remaining permanently exempt. Consumer protection standards must remain robust even within experimental frameworks.
The Enforcement Balance: Compliance Culture versus Innovation Culture
Financial institutions increasingly struggle to balance robust compliance cultures necessary for regulatory relationships with innovative cultures required for competitive survival. The challenge becomes particularly acute for institutions serving diverse communities where traditional approaches may inadvertently create discriminatory outcomes.
The Wells Fargo “fake accounts” scandal illustrates how compliance failures can devastate institutional credibility and customer relationships. However, the aftermath also demonstrates how excessive focus on compliance processes can stifle legitimate business development and customer service improvements. The institution’s innovation initiatives faced heightened scrutiny that slowed product development and market expansion efforts.
CDFIs provide alternative models that successfully integrate strong compliance cultures with innovative service delivery. CDFIs maintain exemplary safety and soundness records with superior risk management performance. According to the CDFI Fund’s 2024 Annual Report, the CDFI industry has over $436 billion in total assets and maintains strong financial performance metrics, with the industry demonstrating resilience and growth while serving underserved markets (CDFI Fund. (2024)). Their success suggests that compliance and innovation can be complementary when properly aligned.
The key appears to be embedding compliance considerations into innovation processes from inception rather than treating them as conflicting objectives. Fair lending analysis, consumer protection review, and safety and soundness assessment become integral parts of product development rather than external obstacles to overcome.
Technology solutions can support this integration through automated monitoring and real-time compliance checking. Algorithmic bias detection can identify discriminatory patterns before they affect customers. Transaction monitoring can flag unusual patterns while enabling innovative service delivery. Customer complaint analysis can identify problems before they escalate to regulatory attention.
The International Competitiveness Dimension
American financial regulatory approaches increasingly face international competitive pressures as other jurisdictions develop more innovation-friendly frameworks while maintaining appropriate consumer protections. The European Union’s Open Banking initiative, requiring banks to share customer data with authorized third-party providers, has accelerated fintech innovation while enhancing consumer choice.
Singapore’s regulatory sandbox approach has attracted fintech companies from around the world, creating a regional hub for financial innovation that generates economic development and export opportunities. The Monetary Authority of Singapore’s collaborative approach with industry enables rapid testing and deployment of new technologies while maintaining system stability.
China’s financial technology development, despite regulatory uncertainties, has created payment and lending infrastructure that serve hundreds of millions of users with sophisticated algorithms and user interfaces. While the authoritarian governance model creates problems unsuitable for American adoption, the technological capabilities demonstrate what becomes possible when regulatory frameworks adapt quickly to market innovations.
The competitive implications extend beyond financial services to broader economic competitiveness. Countries that develop efficient capital allocation systems attract entrepreneurial talent and investment capital while fostering innovative ecosystems that generate employment and tax revenue. Regulatory frameworks that inadvertently limit capital access or slow innovation adoption risk economic stagnation relative to more adaptive jurisdictions.
The Path Forward: Principles-Based Regulation for Inclusive Innovation
The regulatory challenges require evolution toward principles-based approaches that establish clear objectives while allowing flexibility in implementation methods. Rather than prescriptive rules that quickly become obsolete, regulators need frameworks that adapt to technological change while maintaining core protections for consumers and systemic stability.
Fair lending principles provide useful models for this approach. Rather than specifying exactly which data sources or analytical methods lenders must use, fair lending law establishes outcome-based standards prohibiting discriminatory treatment while allowing innovation in underwriting approaches. Lenders can experiment with alternative data and new technologies provided they can demonstrate non-discriminatory impact and appropriate risk management.
Consumer protection principles similarly focus on outcomes—accuracy, transparency, privacy, and appropriate use—rather than specific processes or technologies. This approach enables beneficial innovations like rent reporting while preventing harmful applications of personal data. Clear safe harbors for beneficial uses provide regulatory certainty that encourages private sector investment in inclusive financial technologies.
Safety and soundness principles must evolve to recognize that variety in lending portfolios and service delivery methods can enhance rather than threaten institutional stability. CDFIs demonstrate that serving underserved markets with specialized expertise can produce superior risk-adjusted returns compared to mainstream approaches.
The implementation requires enhanced regulatory capabilities for outcome monitoring and adaptive policy making. Real-time data analysis can identify emerging risks or discriminatory patterns before they create systemic problems. Regular stakeholder engagement ensures that policy development incorporates perspectives from all affected communities. International coordination prevents regulatory arbitrage while sharing best practices for innovation-friendly oversight.
Want to hear directly from our CEO, Joe Cecala, on these topics? Register for our free webinar today: https://event.webinarjam.com/register/280/94yr4f3p
Conclusion
The Moment of Decision
America’s capital markets stand at a crossroads that will determine whether the next generation inherits an efficient, equitable system that allocates resources to their highest value uses, or an increasingly exclusive club that concentrates opportunity among existing elites while leaving vast potential untapped.
The evidence presented throughout this analysis points to a single, unavoidable conclusion: systematic barriers that exclude creditworthy households and viable businesses from capital markets represent both moral failures and economic inefficiencies of staggering magnitude. The estimated $10 trillion in household wealth locked outside the capital formation system through discriminatory lending practices, inadequate information production and regulatory barriers does not just harm excluded communities—it reduces productivity and innovation for the entire economy.
Consider the cascading effects when 26 million credit-invisible adults cannot access mortgages despite demonstrated payment capacity through rent history (Consumer Financial Protection Bureau. (2015)). These households cannot build wealth through homeownership, cannot leverage home equity for small business formation, and cannot participate in the stock market through retirement accounts tied to employer-sponsored plans. Their exclusion perpetuates itself across generations while depriving the broader economy of their entrepreneurial potential and consumer spending power.
Venture Capital Allocation Patterns Tell a Story of Systematic Waste
The venture capital allocation patterns tell a similar story of systematic waste. When Black-founded startups receive only 0.4% of venture funding despite representing 13% of the population (Davis, D.M. (2025)), the disparity suggests not merit-based selection but structural barriers that prevent promising innovations from reaching the market, and inevitably the public capital markets. The economic cost includes not only foregone returns for investors but technological advances that never emerge and jobs that never get created.
Regional concentration compounds these inefficiencies, expanding the underserved beyond merely racial disparity. With more than half of venture capital firms concentrated in just three metropolitan areas—San Francisco, Boston, and New York—promising entrepreneurs in secondary markets face geographic barriers that have nothing to do with their business potential (Chen, H., Gompers, P., Kovner, A., & Lerner, J. (2009). The result is systematic underinvestment in innovation outside coastal regions, contributing to regional economic disparities that fuel political polarization and social instability.
The Bipartisan Foundation for Action
Perhaps most remarkably, the solutions to these market failures rest on solid bipartisan political foundations that suggest realistic prospects for implementation. Republicans and Democrats disagree about many economic policies, but both parties recognize that efficient capital allocation and broad economic opportunity serve fundamental American values.
Senate Banking Committee Chair Tim Scott’s characterization of indiscriminate debanking as “un-American” reflects conservative recognition that market-based systems must operate fairly to maintain legitimacy (Scott, T. (2025)). His legislative agenda to eliminate subjective risk standards and enhance due process in account closure decisions addresses real market failures rather than expanding government involvement in private sector decisions (ibid).
Ranking Member of the Senate Banking Committee, Elizabeth Warren’s emphasis on consumer protection and coordinated federal enforcement similarly addresses market failures through improved regulation rather than direct government allocation of credit (Warren, E. (2025)) Her collaboration with Representative Ilhan Omar on banking access for Muslim Americans (Omar, I. (2024)) demonstrates how civil rights and market efficiency objectives align when systematic barriers are removed.
House Financial Services leadership under Patrick McHenry emphasized that capital formation should “benefit every single district” rather than concentrating in wealthy regions or demographic groups (See McHenry’s remarks as reported by the House Financial Services Committee, (2024)). This geographic fairness focus appeals to Republican constituencies while addressing Democratic concerns about equitable growth and community development.
The CDFI program exemplifies successful bipartisan policy that achieves both conservative market-efficiency objectives and liberal social equity goals (Pinksy, Mark (2001). Senators Mike Crapo and Mark Warner’s joint support for CDFI expansion (Crapo (2025)) recognizes that specialized institutions can serve underserved markets profitably while generating measurable economic development outcomes.
The Innovation Foundation is Already Built
The regulatory infrastructure necessary for expanding capital access already exists through carefully designed frameworks that balance investor protection with capital formation needs. Regulation Crowdfunding and Regulation A+ have facilitated over $10 billion in capital raising since implementation (Securities and Exchange Commission, Securities and Exchange Commission, Division of Economic and Risk Analysis. (2025, May). Analysis of crowdfunding under the JOBS Act. and Securities and Exchange Commission, Division of Economic and Risk Analysis. (2025, May). Analysis of the Regulation A market: A decade of Regulation A)), proving both market demand and regulatory viability.
The challenge lies not in creating new bureaucratic systems but in optimizing existing frameworks through targeted adjustments that remove friction points while maintaining appropriate safeguards. SEC Commissioner Hester Peirce’s reform agenda addresses specific barriers—secondary market liquidity restrictions, state qualification complexities, ongoing reporting burdens—that discourage broader adoption without fundamental framework reconstruction.
CDFIs demonstrate how specialized expertise can achieve superior risk-adjusted returns while serving markets that mainstream institutions avoid. The CDFI sector maintains consistently low delinquencies and strong performance records while generating substantial lending to businesses and communities locked out of traditional credit markets (Pinksy, Mark. (2001)).
Technology solutions like rent reporting show how alternative data can expand access while improving rather than compromising risk assessment accuracy. Esusu’s billion-dollar valuation and measurable credit score improvements for participants — with an average credit score increase of 36+ points for enrolled renters — prove that market solutions exist for systematic barriers when policy frameworks enable rather than obstruct innovation (Esusu Financial Inc. (2023)).
The Choice: Proactive Strategy or Reactive Crisis
The choice facing American leadership is not whether to address capital market inefficiencies, but whether to address them proactively and sooner through strategic coordination or reactively later through crisis response.
Proactive strategic implementation would coordinate regulatory optimization, private sector innovation, and measurement accountability across all three dimensions simultaneously. Regulatory changes could improve secondary market liquidity for small issuers while establishing clear safe harbors for alternative data lending. Private sector institutions could systematically adopt equitable underwriting approaches while maintaining risk discipline through enhanced monitoring and varied portfolio construction. Policy frameworks could ensure that expanded access translates into measurable improvements in job creation, business formation, and community development.
The benefits would compound across stakeholders. Institutional investors and retail investors would gain access to systematically undervalued opportunities in neglected markets while achieving improved living standards, environmental technology objectives and expanding life changing innovation through measurable social impact. Small businesses and growth companies would access capital at efficient rates while building relationships with investors committed to long-term value creation rather than quick exits. Underserved communities would gain pathways to wealth building and entrepreneurship while contributing to broader economic growth through increased productivity and innovation.
Reactive crisis response would wait for market failures to trigger broader systemic disruptions before implementing corrective measures. History suggests such crises emerge when systematic exclusion reaches levels that threaten social stability and political legitimacy and destabilize the nation’s production. The responses typically involve heavy-handed regulatory interventions that reduce overall market efficiency while attempting to address inequality through redistributive mechanisms rather than removing barriers to productive participation often at the cost of any true production and merit based economic system.
The Moral and Economic Imperative Converge
The evidence demonstrates conclusively that moral imperatives and economic efficiency align when capital markets function properly. Systematic barriers that exclude creditworthy borrowers and viable businesses represent pure economic waste—resources that could generate positive returns for investors while creating jobs, building communities, and fostering innovation.
Market Efficiency Demands Full Participation
The goal of capital market optimization is not equality of outcomes but equality of access to mechanisms through which individuals and businesses can pursue economic opportunity based on merit and effort. When systematic barriers prevent creditworthy borrowers and viable businesses from accessing capital markets, the entire system operates below optimal efficiency.
The $10 trillion opportunity represents household wealth that could fund the next generation of American business growth and innovation while building individual and community prosperity. The venture capital allocation patterns that systematically underinvest in women and minority entrepreneurs waste technological potential while generating suboptimal returns for institutional investors (McKinsey & Company (2023)). The regional concentration that limits capital access outside major metropolitan areas reduces innovation and competition while contributing to political polarization through uneven economic development (Chen, H., Gompers, P., Kovner, A., & Lerner, J. (2009)). The absence of public capital market access to all communities across the nation denies the democratization of the free marketplace of ideas and wealth creation of all Americans.
The evidence proves that removing these barriers would generate superior economic returns while advancing social equality. The regulatory frameworks exist. The technology solutions work. The political support crosses party lines. The only question remaining is whether American leadership will seize this $10 trillion opportunity or let it slip away through inaction.
The choice we make today will determine whether American capital markets remain engines of opportunity and innovation as they have been for more than a century or become instruments of exclusion and stagnation. The data, the stories, and the solutions all point toward the same conclusion: equitable markets are efficient markets. The time to act with real solutions is now.
Want to hear directly from our CEO, Joe Cecala, on these topics? Register for our free webinar today: https://event.webinarjam.com/register/280/94yr4f3p
